Python/Data Visualization
[Kaggle 데이터 활용] 여러 개의 그래프 한번에 그리기(2) 기초
ISLA!
2023. 8. 10. 15:28
여러 개의 그래프 한번에 그리기
plotly.subplots 를 사용하여 다음과 같이 2개 이상의 그래프를 한번에 그릴 수 있다
from plotly.subplots import make_subplots
import plotly.graph_objects as go

x1 = [1, 2, 3]
x2 = [4, 5, 6]
y1 = [10, 20, 30]
y2 = [50, 60, 70]

fig = make_subplots(rows = 1, cols = 2
                   , subplot_titles=("Plot 1", "Plot 2")
                   , column_widths = [0.7, 0.3]) #size control

fig.add_trace(
    go.Scatter(x = x1, y = y1)
            ,row = 1, col = 1
)
fig.show()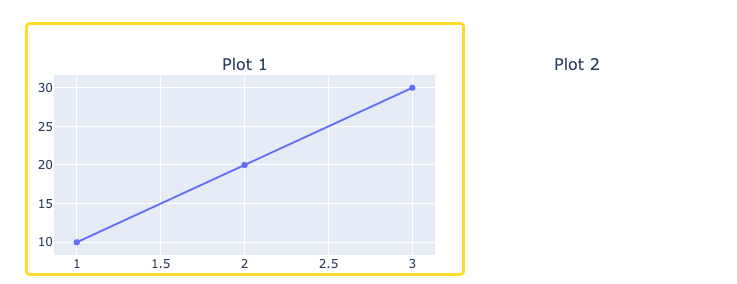
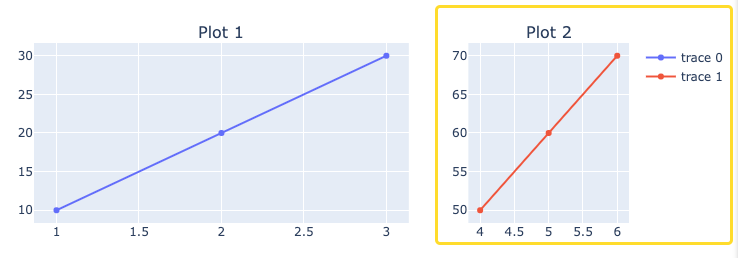
이제 코드를 추가해서 plot2 도 그려보면 다음과 같다.
from plotly.subplots import make_subplots
import plotly.graph_objects as go

x1 = [1, 2, 3]
x2 = [4, 5, 6]
y1 = [10, 20, 30]
y2 = [50, 60, 70]

fig = make_subplots(rows = 1, cols = 2
                   , subplot_titles=("Plot 1", "Plot 2")
                   , column_widths = [0.7, 0.3]) #size control

fig.add_trace(
    go.Scatter(x = x1, y = y1)
            ,row = 1, col = 1
)

fig.add_trace(
    go.Scatter(x = x2, y = y2)
            ,row = 1, col = 2
)

fig.show()
728x90