이번 포스팅에서는 5의 고객군 분석에 이어, 코호트 분석을 진행한다.

Cohort Analysis
코호트는 어떤 공통점을 공유하는 사람들의 그룹을 의미한다.
이러한 공통점은 앱 가입 날짜, 처음 구매한 달, 지리적 위치, 획득 채널 (일반 사용자, 마케팅 유입자 등) 등이 될 수 있다.
코호트 분석에서는 이러한 사용자 그룹을 시간에 따라 추적하여 일반적인 패턴이나 행동을 식별하기 위해 사용된다.
본 예제에서는 코호트 분석 함수를 정의했으며, 함수가 긴 관계로 끊어서 설명하고 마지막에 최종 함수를 기록할 것이다.
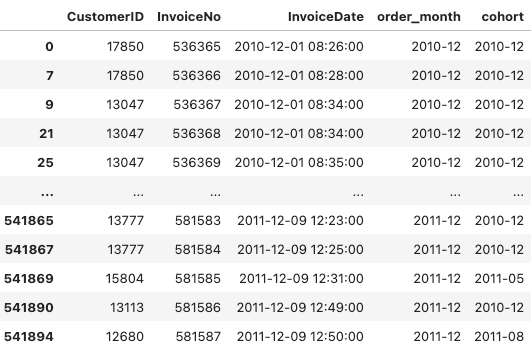
cohort(최초 주문일과 고객 당 주문 건의 날짜 추출)
- 데이터 프레임을 복사
- 고객 ID, 송장번호, 주문날짜만 추출하고, 중복된 행 제거
- 날짜를 월 단위의 기간(Period)으로 변환 : 각 주문의 날짜를 해당 월의 첫 번째 날로 변환하고 해당 월을 나타내는 기간으로 표현
- 고객 ID를 기준으로 그룹화 :
- 각 고객에 대해, 주문날짜(InvoiceDate)열의 최솟값(가장 이른 주문 날짜)을 찾는다.
- 가장 이른 주문 날짜를 월 단위 기간으로 변환
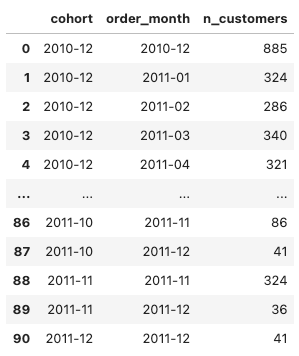
- cohort 열과 order_month 열을 기준으로 그룹화 :
- 각 그룹에 대해 고유한 고객ID의 수을 계산하여 n_customers 에 저장
def CohortAnalysis(dataframe):

    data = dataframe.copy()
    data = data[["CustomerID", "InvoiceNo", "InvoiceDate"]].drop_duplicates()

    data['order_month'] = data['InvoiceDate'].dt.to_period('M')
    data['cohort'] = data.groupby('CustomerID')['InvoiceDate'].transform('min').dt.to_period('M')
    cohort_data = (
        data.groupby(['cohort', 'order_month']).agg(n_customers = ('CustomerID', 'nunique'))\
            .reset_index(drop = False)
    )
최초 주문일과 주문 건별 일수 차이 계산
- order_month 와 cohort 의 날짜 차이를 계산하되 .apply(attrgetter('n')) 함수를 적용하여 객체에서 n 속성 값을 추출한다.
- attrgetter는 파이썬의 operator 모듈에서 제공하는 함수 중 하나이다.
from operator import attrgettercohort_data['period_number'] = (cohort_data.order_month - cohort_data.cohort).apply(attrgetter('n'))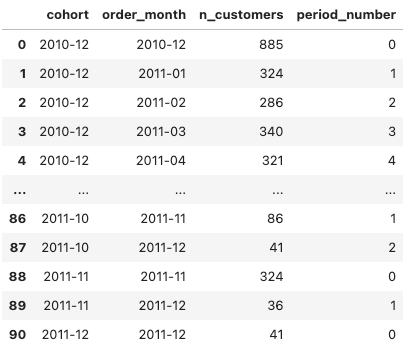
pivot_table 로 코호트(최초 구매일) 기준, 경과 시간 별 구매 고객 수 계산
cohort_pivot = cohort_data.pivot_table(
        index = 'cohort', columns = 'period_number', values = 'n_customers'
    )

# 코호트 초기 고객수
cohort_size = cohort_pivot.iloc[:, 0]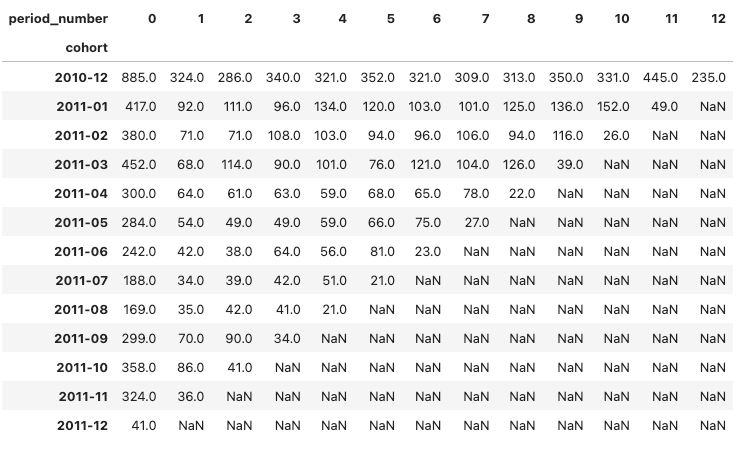
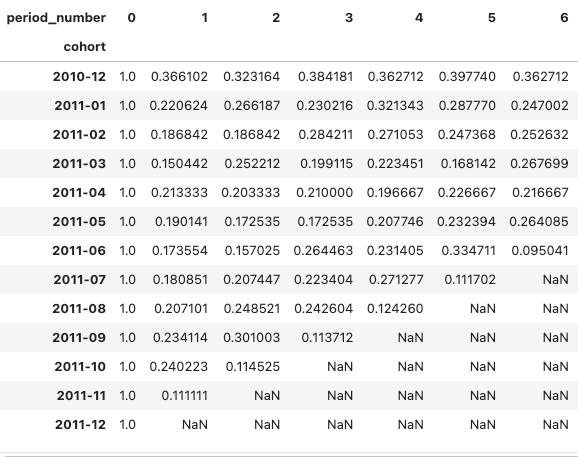
고객 유지율 계산
- 피벗테이블의 각 행을 'cohort_size' 변수로 나누어, 고객 유지율(이탈율 파악용) 계산
- divide() 함수는 행을 나눌 때 사용되며, axis = 0 매개변수로 각 행을 나누고 있음을 나타낸다.
- 이렇게 각 cohort에 대한 이탈률이 계산되며, 결과가 retention_matrix 변수에 저장된다.
retention_matrix = cohort_pivot.divide(cohort_size, axis = 0)
🚀 고객 유지율 시각화(heatmap)
- with sns.axes_style('white') : 배경을 흰색으로
- fig, ax ~ : sharey = True (두 개의 하위 그림이 동일한 y-축을 공유)
- gridspec_kw = {'width_ratios':[0.1, 1]} : 두 그림의 너비 비율 설정
- ax[1] 히트맵 : retention_matrix 활용하고, null 값은 가림
- white_cmap 생성 : 리스트로 지정한 컬러로 colormap 만들기
- import matplotlib.colors as mcolors
- mcolors.ListedColormap() 함수
- cohort_size 인덱스와 값을 데이터프레임으로 변환하여 히트맵 왼쪽에 추가
- fmt = 'g' : 주석의 숫자 형식을 일반 숫자 형식(general)로 지정
- 예를 들어, fmt='g'로 설정된 경우, 숫자 1000은 "1000"으로 표시되고, 숫자 0.001은 "0.001"로 표시됨!
with sns.axes_style('white'):     # 배경을 흰색으로 설정

        fig, ax = plt.subplots(
                    1, 2, figsize = (12, 8), sharey = True, gridspec_kw = {'width_ratios':[0.1, 1]}
                    )

        sns.heatmap(retention_matrix,
                    mask = retention_matrix.isnull(),
                    annot = True,
                    cbar = True,
                    fmt = '.0%',
                    cmap = 'coolwarm',
                    ax = ax[1])

        ax[1].set_title("Monthly Cohorts: User Retention", fontsize=14)
        ax[1].set(xlabel='# of periods', ylabel = " ")

        white_cmap = mcolors.ListedColormap(['white'])

        sns.heatmap(pd.DataFrame(cohort_size).rename(columns = {0:'cohort_size'}),
                   annot = True, cbar = False, fmt = 'g', cmap = white_cmap, ax = ax[0])

    fig.tight_layout()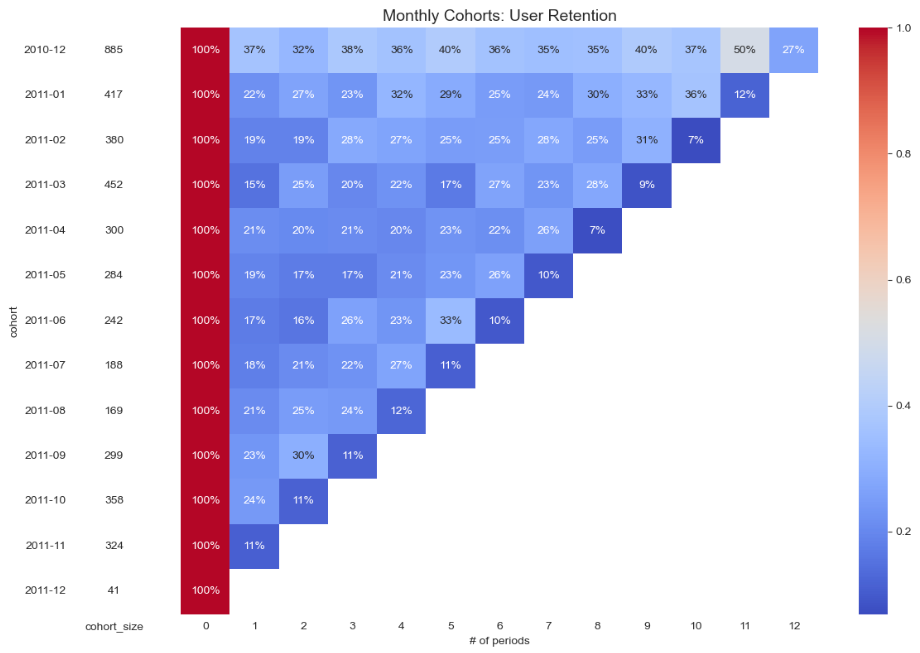
🚀 고객 유지율 시각화 전체 함수
펼쳐보세요!
더보기
def CohortAnalysis(dataframe):

    data = dataframe.copy()
    data = data[["CustomerID", "InvoiceNo", "InvoiceDate"]].drop_duplicates()

    data['order_month'] = data['InvoiceDate'].dt.to_period('M')
    data['cohort'] = data.groupby('CustomerID')['InvoiceDate'].transform('min').dt.to_period('M')
    cohort_data = (
        data.groupby(['cohort', 'order_month']).agg(n_customers = ('CustomerID', 'nunique'))\
            .reset_index(drop = False)
    )

    cohort_data['period_number'] = (cohort_data.order_month - cohort_data.cohort).apply(attrgetter('n'))

    cohort_pivot = cohort_data.pivot_table(
        index = 'cohort', columns = 'period_number', values = 'n_customers'
    )
    cohort_size = cohort_pivot.iloc[:, 0]

    # 고객 이탈율/유지율 계산
    retention_matrix = cohort_pivot.divide(cohort_size, axis = 0)

    # 시각화
    with sns.axes_style('white'):     # 배경을 흰색으로 설정

        # 두 개의 하위 그림이 동일한 y-축을 공유(sharey = True) / 하위 그림의 너비 비율(동일)
        fig, ax = plt.subplots(
                    1, 2, figsize = (12, 8), sharey = True, gridspec_kw = {'width_ratios':[0.1, 1]}
                    )

        sns.heatmap(retention_matrix,
                    mask = retention_matrix.isnull(),
                    annot = True,
                    cbar = True,
                    fmt = '.0%',
                    cmap = 'coolwarm',
                    ax = ax[1])

        ax[1].set_title("Monthly Cohorts: User Retention", fontsize=14)
        ax[1].set(xlabel='# of periods', ylabel = " ")

        white_cmap = mcolors.ListedColormap(['white'])

        sns.heatmap(pd.DataFrame(cohort_size).rename(columns = {0:'cohort_size'}),
                   annot = True, cbar = False, fmt = 'g', cmap = white_cmap, ax = ax[0])

    fig.tight_layout()
728x90
'Machine Learning > Case Study 👩🏻💻' 카테고리의 다른 글
| [BG/NBD] 고객 거래 행동 예측 모델 (2) | 2023.10.10 |
|---|---|
| [Kaggle] 이커머스 데이터 분석 7 (CRM Analytics 🛍️🛒) (1) | 2023.10.10 |
| [Kaggle] 이커머스 데이터 분석 5 (CRM Analytics 🛍️🛒) (1) | 2023.10.08 |
| [Kaggle] 이커머스 데이터 분석 4 (CRM Analytics 🛍️🛒) (1) | 2023.10.08 |
| [Kaggle] 이커머스 데이터 분석 3 (CRM Analytics 🛍️🛒) (1) | 2023.10.08 |


