♻️ 순환경제 활성화를 위한 서울시 스마트 수거함 입지 선정
행정동 군집 분석 목적
- 서울시 전체 행정동 중 우선적으로 스마트 수거함 확대가 필요한 행정동 1차 추출을 위함
01. Feature 선정
- 가정을 세워 스마트 수거함 입지 선정에 중요한 요인으로 작용할 것이라 예상되는 변수를 선정
- 가정 1 : PET병 배출량이 많을수록 수거함은 더 많이 필요하다
- 가정 2 : 1인 가구는 PET병의 소단위 구매가 많아, 단위당 PET병 배출량이 많을 것이다
- 가정 3 : 재활용 및 분리배출은 전체 인구 중 생활인구 보다 거주인구 비율이 더 높을 것이다
👉 선정된 Feature : PET 예측량, 1인 가구수, 총 거주 인구수, 수거함 1개 당 거주인구수
02. K(군집 개수) 선정
- Elbow Method, Silhiuette Scores Method 를 확인하여 적합한 군집 개수 설정
- 엘보우 그래프에서 기울기가 급격히 감소하는 지점의 k 값과 실루엣 계수를 확인하여 k = 3으로 선정

🧑🏻💻 k-means Clustering CODE
더보기
K 값 선정을 위한 코드
import numpy as np
from sklearn.cluster import KMeans
from sklearn.metrics import silhouette_score, silhouette_samples
import matplotlib.pyplot as plt
import seaborn as sns

df = pd.read_csv('./for_k_means.csv')

# Define a function to visualize silhouette scores
def visualize_silhouette(X, cluster_labels):
    silhouette_avg = silhouette_score(X, cluster_labels)
    sample_silhouette_values = silhouette_samples(X, cluster_labels)
    y_lower = 10

    fig, ax1 = plt.subplots()
    ax1.set_xlim([-0.1, 1])
    ax1.set_ylim([0, len(X) + (k + 1) * 10])

    for i in range(k):
        ith_cluster_silhouette_values = sample_silhouette_values[cluster_labels == i]
        ith_cluster_silhouette_values.sort()
        size_cluster_i = ith_cluster_silhouette_values.shape[0]
        y_upper = y_lower + size_cluster_i

        color = plt.cm.nipy_spectral(float(i) / k)
        ax1.fill_betweenx(np.arange(y_lower, y_upper),
                          0, ith_cluster_silhouette_values,
                          facecolor=color, edgecolor=color, alpha=0.7)

        ax1.text(-0.05, y_lower + 0.5 * size_cluster_i, str(i))
        y_lower = y_upper + 10

    ax1.set_xlabel("The silhouette coefficient values")
    ax1.set_ylabel("Cluster label")

    ax1.axvline(x=silhouette_avg, color="red", linestyle="--")
    ax1.set_yticks([])
    ax1.set_xticks([-0.1, 0, 0.2, 0.4, 0.6, 0.8, 1])

# Select columns for clustering
selected_cols = ['PET 총량', '1인가구', '수거함당_평균_거주인구수']

X = df[selected_cols]

# K values range
k_range = range(1, 11)

# Inertia
inertia = []

# Silhouette scores
silhouette_scores = []

# K-means clustering
for k in k_range:
    kmeans = KMeans(n_clusters=k, random_state=0)
    kmeans.fit(X)
    inertia.append(kmeans.inertia_)

    if k > 1:  # Silhouette score is not defined for a single cluster
        labels = kmeans.labels_
        silhouette_avg = silhouette_score(X, labels)
        silhouette_scores.append(silhouette_avg)

# Elbow
fig, ax = plt.subplots()
sns.lineplot(x=k_range, y=inertia, marker='o', ax=ax)
ax.set(xlabel='Number of clusters (K)', ylabel='Inertia', title='Elbow Method for Optimal K')
plt.show()

# Silhouette scores plot
fig, ax = plt.subplots()
sns.lineplot(x=k_range[1:], y=silhouette_scores, marker='o', ax=ax)
ax.set(xlabel='Number of clusters (K)', ylabel='Silhouette Score', title='Silhouette Scores for Optimal K')
plt.show()

# Visualize silhouette scores for k=2 and k=3
for k in [2, 3]:
    kmeans = KMeans(n_clusters=k, random_state=0)
    cluster_labels = kmeans.fit_predict(X)
    visualize_silhouette(X, cluster_labels)
    plt.title(f'Silhouette Plot for K={k}')
    plt.show()


print(' 군집결과 '.center(100, '-'))
print('------'.center(100, '-'))

import geopandas as gpd

state_geo = 'https://raw.githubusercontent.com/southkorea/seoul-maps/master/kostat/2013/json/seoul_municipalities_geo_simple.json'
gdf = gpd.read_file(state_geo)
# gdf.head()

# 군집에 쓸 변수
# selected_cols = ['PET 총량', '수거함개수', '1인가구_비율','수거함당_평균_거주인구수']
for_cluster = df[selected_cols]

# k값 설정
k = 3
kmeans = KMeans(n_clusters = k, random_state = 0)
kmeans.fit(for_cluster)

for_cluster['군집화_결과'] = kmeans.labels_

# 구
gu = df[['자치구']]

# 군집화 결과+구
cluster_df = pd.concat([for_cluster, gu], axis = 1)

# 군집화 결과 시각화
cluster_map = gdf.merge(cluster_df, left_on='name', right_on='자치구')
cluster_map.plot(column='군집화_결과', cmap='YlGn', linewidth=0.8, edgecolor='0.8')
ax.set_title("자치구 군집 결과", fontsize=10)  # 그래프 제목 설정

# 그래프 표시
plt.show()

print('------'.center(100, '-'))
print(cluster_df['군집화_결과'].value_counts())
03. 클러스터링 결과
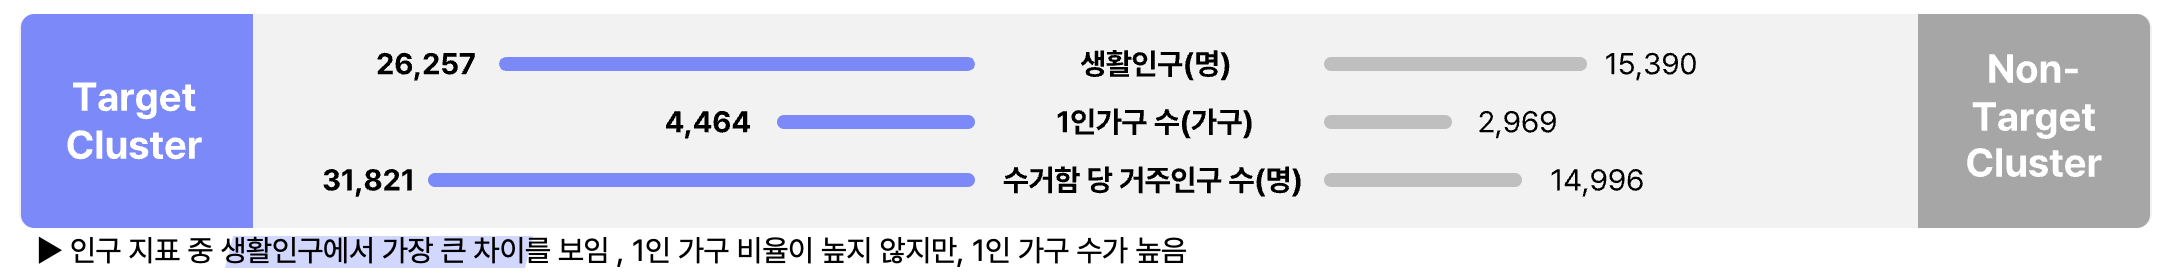
- 3개의 군집의 특성을 비교하여 군집 1을 Target으로 선정
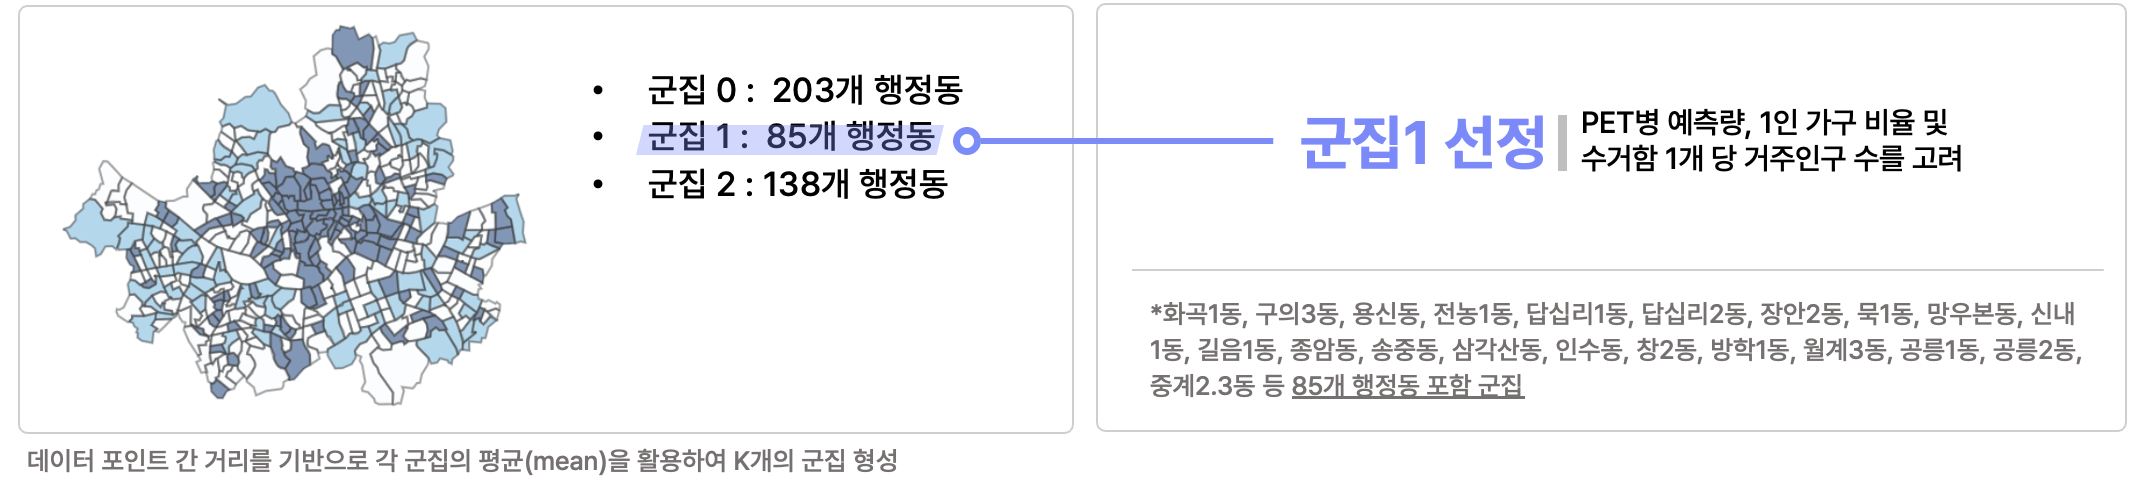
- 군집 1의 특징 : 높은 생활인구수 및 수거함 당 거주인구수를 보이며, 1인 가구수가 많음
728x90
'Projects > Bigdata Campus 공모전' 카테고리의 다른 글
| [스마트 수거함 입지 선정] 5. Target 행정동 수거함 입지 선정 (2) | 2023.12.19 |
|---|---|
| [스마트 수거함 입지 선정] 4. 행정동 별 입지 지수 선정(PCA) (0) | 2023.12.19 |
| [스마트 수거함 입지 선정] 2. 행정동 PET 배출량 도출 (0) | 2023.12.19 |
| [스마트 수거함 입지 선정] 1. 주제 선정 배경 및 개요 (0) | 2023.12.19 |


