이 포스팅은 이커머스 데이터 분석 과정을 스터디하기 위해 다음 kaggle 노트를 참고했습니다.
https://www.kaggle.com/code/sercanyesiloz/crm-analytics

라이브러리 import
import os
import datetime
# import squarify
import warnings
import pandas as pd
import numpy as np
import datetime as dt
from operator import attrgetter
import seaborn as sns
import matplotlib.pyplot as plt
import matplotlib.colors as mcolors
import plotly.graph_objs as go
from plotly.offline import iplot
from sklearn.metrics import (silhouette_score,
                             calinski_harabasz_score,
                             davies_bouldin_score)
from lifetimes import BetaGeoFitter, GammaGammaFitter
from lifetimes.plotting import plot_period_transactions
%matplotlib inline
%load_ext nb_black
warnings.filterwarnings('ignore')
sns.set_style('whitegrid')
palette = 'Set2'
데이터셋 로드 및 확인
👉 여기서 데이터를 불러올 때 옵션을 추가로 준다. 인코딩뿐만 아니라 데이터 타입 변경이 가능하다.
- encoding='unicode_escape : 특수문자가 있는 csv 파일에 대해 일반적으로 사용되는 인코딩 방식
- dtype = {'CustomerID':str, 'InvoiceDate':str} : 각 컬럼을 문자열(str)로 처리
- parse_dates = ['InvoiceDate'] : InvoiceDate 열을 날짜 및 시간 객체로 파싱 하도록 지시(데이터 타입 변경)
- infer_datetime_format = True : 위의 parse_dates와 함께 사용되며, InvoiceDate열의 날짜 및 시간 형식을 추론하여 파싱 속도를 향상함
df = pd.read_csv('./data.csv', encoding = 'unicode_escape',
                dtype = {'CustomerID':str,
                        'InvoiceDate':str},
                parse_dates = ['InvoiceDate'],
                infer_datetime_format = True)
df.head()

데이터 변수 확인
InvoiceNo: 6자리로 이루어진 송장 번호입니다. 이 코드가 'c'로 시작하면 취소된 거래임을 나타냅니다.
StockCode: 5자리 숫자로 이루어진 제품 코드입니다.
Description: 제품 이름입니다.
Quantity: 각 제품의 거래당 수량입니다.
InvoiceDate: 각 거래가 생성된 날짜와 시간을 나타냅니다.
UnitPrice: 제품 단가입니다.
CustomerID: 5자리 숫자로 이루어진 고객 번호입니다. 각 고객은 고유한 고객 ID를 가지고 있습니다.
Country: 각 고객이 거주하는 국가의 이름입니다.
df.info()

데이터 체크하는 함수 정의 : check_data()
- rows, columns 개수 확인
- 칼럼별 데이터 타입
- head, tail
- 결측치 : df.isnull().sum()
- 중복값
[참고]
✔ center(width, fillchar)
이 메서드는 문자열을 가운데 정렬하는 데 사용됨.
- width: 정렬된 결과 문자열의 전체 너비를 나타내며, 이 경우에는 70이다.
- fillchar: 필요한 경우 문자열을 채울 문자를 나타냅니다. 이 경우에는 '-' 문자가 사용된다
def check_data(df, head = 5):
    print(" SHAPE ".center(70, '-'))
    print('Rows: {}'.format(df.shape[0]))
    print('Columns: {}'.format(df.shape[1]))

    print(' Type '.center(70, '-'))
    print(df.dtypes)
    print(' HEAD '.center(70, '-'))
    print(df.head(head))
    print(' TAIL '.center(70, '-'))
    print(df.tail(head))

    print(' Missing Values '.center(70, '-'))
    print(df.isnull().sum())

    print(' Duplicated Values '.center(70, '-'))
    print(df.duplicated().sum())

check_data(df)

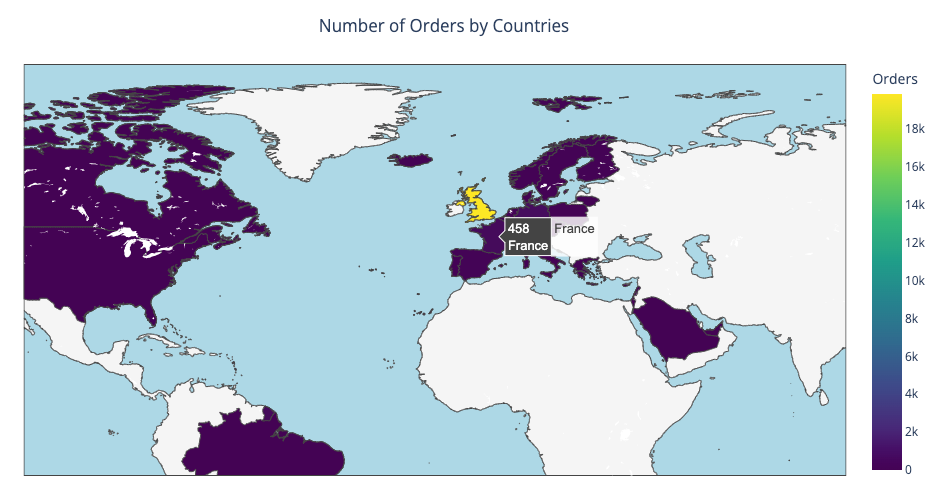
World Map : 매출이 발생한 국가 시각화
지도 구현을 위해 pandas, plotly, plotly-express 가 필요함
# import plotly.graph_objs as go
# Import Pandas
# import plotly.express as px
- 고객 Id, 송장, 국가 별로 그룹화 -> 각 그룹의 count 계산
- 각 국가가 주문받은 횟수를 출력하기 위해, '국가' 열 기반으로 value_counts()
- data로 저장된 딕셔너리 : 지도 설정(choropleth)
- type : 시각화 종류로, choropleth 지도를 지정
- locations : 각 국가를 나타내는 인덱스
- locationmode : 위치 모드로 '국가명' 사용
- z : 각 국가에 대한 주문 수
- text : 마우스를 가져다 대면 표시할 텍스트 데이터
- colorbar : 색상 막대 제목
- colorscale : 사용할 색상 척도
- reversescale : 색상 척도 반전 여부 설정
- layout으로 저장된 딕셔너리 : 지도의 레이아웃과 스타일 설정
- title : 지도 제목, 위치, 앵커
- geo : 지도의 지리적 속성(해상도, 바다색, 육지 색, 프레임 표시 여부)
- template : 플롯 리포트의 템플릿
- height, width : 지도의 높이와 너비
- choromap 변수 : data와 layout을 사용하여 지도 생성
- iplot : 지도를 인터렉티브 하게 표시 (validate = False : 검증을 비활성화하는 것으로, 지도가 정상적으로 렌더링 되는지 확인하지 않는다.
# 고객Id, 송장, 국가 별로 그룹화 -> 각 그룹의 count 계산
world_map = df[['CustomerID', 'InvoiceNo', 'Country']].groupby(['CustomerID', 'InvoiceNo', 'Country']).count().reset_index(drop=False)

# 그룹화 결과에서 '국가' 열 기반으로 국가의 주문수 계산
countries = world_map['Country'].value_counts()

data = dict(type = 'choropleth',           # 생성하려는 지도 종류(choropleth)
           locations = countries.index,    # 지도에 나타내는 지역 인덱스
           locationmode = 'country names',
           z = countries,
           text = countries.index,
           colorbar = {'title':'Orders'},  # 색상 막대의 제목
           colorscale = 'Viridis',
           reversescale = False)    # 색상 척도 반전 여부(false : 값이 커질 수록 진한 색상/true: 밝은색상)


layout = dict(title = {'text': "Number of Orders by Countries",
                      'y': 0.9,
                      'x' : 0.5,
                      'xanchor': 'center',
                      'yanchor': 'top'},
             geo = dict(resolution = 50,
                       showocean = True,
                       oceancolor = 'LightBlue',
                       showland = True,
                       landcolor = 'whitesmoke',
                       showframe = True),
             template = 'plotly_white',
             height = 600,
             width = 1000)

choromap = go.Figure(data = [data], layout = layout)
iplot(choromap, validate = False)
👉 이렇게 마우스를 호버 하면 국가명과 주문 건수가 나타나는 인터렉티브 한 지도가 표시된다!
728x90
'Machine Learning > Case Study 👩🏻💻' 카테고리의 다른 글
| [Kaggle] 이커머스 데이터 분석 3 (CRM Analytics 🛍️🛒) (1) | 2023.10.08 |
|---|---|
| [Kaggle] 이커머스 데이터 분석 2 (CRM Analytics 🛍️🛒) (0) | 2023.10.08 |
| [공모전 수상작 스터디] 일회용품 쓰레기 감소를 위한,다회용기 비즈니스 모델 개발 (서울시 빅데이터 캠퍼스) (1) | 2023.10.05 |
| [kaggle] 피마 인디언 당뇨병 예측 (0) | 2023.09.29 |
| [🦀 게 나이 예측(6)] Baseline Modeling 2 (LAD Regression) (0) | 2023.09.26 |


